10,000+
Video Courses
5,000+
Expert Trainers
100M+
Learners Served
50,000+
Learning Hours
Annual Membership
Become a valued member of Tutorials Point and enjoy unlimited access to our vast library of top-rated Video Courses
Subscribe now!
In-Demand Courses
Enhance your e-learning journey with over 10000+ courses curated and delivered for your professional and personal growth
Python


Artificial Intelligence & Machine Learning Introductory Program
8 Lectures

New price:
Previous price:

Tutorialspoint Python advanced practical learning course
732 Lectures

New price:
Previous price:

Complete Python Guide: Basics to Real-World Projects
160 Lectures

New price:
Previous price:

Python in English: From Beginner to Professional
45 Lectures

New price:
Previous price:
Cyber Security


Cybersecurity Fundamentals & Certification Prep – ISC2 Pathway
47 Lectures

New price:
Previous price:

Cyber security Incident Handling and Response
10 Lectures

New price:
Previous price:

CompTIA Security+ (SY0-701) Certification Preparation
76 Lectures

New price:
Previous price:

Cloud Security Fundamentals: Protect Data, Apps & Infra
51 Lectures

New price:
Previous price:

Mastering API Security for Pentesting & Bug Bounties 2025
28 Lectures

New price:
Previous price:
Marketing


Brand Strategy for the Digital and Metaverse Era
8 Lectures

New price:
Previous price:

Data-Driven Marketing: Predictive Models and ROI Personalization
9 Lectures

New price:
Previous price:

Complete SEO course for Beginners: Step-by-Step SEO Mastery
42 Lectures

New price:
Previous price:

Complete SEO for Beginners: Step-by-Step SEO Mastery
42 Lectures

New price:
Previous price:
Data Science


Supervised/Unsupervised Machine Learning Projects
14 Lectures

New price:
Previous price:

Artificial Intelligence Masterclass Real-World AI Projects
0 Lectures

New price:
Previous price:

Master AI & Automation: Future-Proof Your Career - A 2023 Guide
100 Lectures

New price:
Previous price:

Mastering Conflict Resolution: Tools, Strategies & Practice
100 Lectures

New price:
Previous price:

Mastering Desk-Bound Wellness: Ergonomics, Nutrition & Movement
100 Lectures

New price:
Previous price:
Web Development


3 Responsive Web Design Projects Using React and Vite
43 Lectures

New price:
Previous price:

React 19 Mastery: Advanced Patterns, Performance, Routing & more
49 Lectures

New price:
Previous price:

Laravel 12: Online Library Management System (OLMS) From A-Z
100 Lectures

New price:
Previous price:

Front-End Web Development Masterclass: From Beginner to Pro
256 Lectures

New price:
Previous price:
Expand your Career opportunities with our Python courses
Kickstart your coding journey with our complete collection of Python Programming. Master this in-demand language from basics to advanced from global experts online. Learn fundamentals of Coding, Data Structures, Object-Oriented Programming, and more. Pave the way to set your career in Data Science, Artificial Intelligence, and Machine Learning with Python online courses and certifications.
Get Started
Artificial Intelligence & Machine Learning Introductory Program
8 Lectures

New price:
Previous price:

Tutorialspoint Python advanced practical learning course
732 Lectures

New price:
Previous price:

Complete Python Guide: Basics to Real-World Projects
160 Lectures

New price:
Previous price:

Python in English: From Beginner to Professional
45 Lectures

New price:
Previous price:
Expand your Career opportunities with our cyber Security courses
Secure your future with our online Cyber Security courses. Master the trade by gaining essential knowledge in Ethical Hacking and protecting systems from cyber threats. Our courses cater to beginners, providing certificates to showcase your expertise. Equip yourself with vital skills and become an Ethical Hacker, defending digital landscapes from malicious attacks.
Get Started
Cybersecurity Fundamentals & Certification Prep – ISC2 Pathway
47 Lectures

New price:
Previous price:

Cyber security Incident Handling and Response
10 Lectures

New price:
Previous price:

CompTIA Security+ (SY0-701) Certification Preparation
76 Lectures

New price:
Previous price:

Cloud Security Fundamentals: Protect Data, Apps & Infra
51 Lectures

New price:
Previous price:

Mastering API Security for Pentesting & Bug Bounties 2025
28 Lectures

New price:
Previous price:
Expand your career opportunities with our Marketing courses
Unlock the power of Digital Marketing and get career-ready with our online courses. Pave your way into a marketing niche by adding exclusive skills to your resume. Tap into various fields like Affiliate Marketing, Social Media strategies, Branding, Content Marketing, and SEO techniques. Our diverse and comprehensive courses offer certificates to accredit your expertise and pave the way for a successful marketing career.
Get Started
Brand Strategy for the Digital and Metaverse Era
8 Lectures

New price:
Previous price:

Data-Driven Marketing: Predictive Models and ROI Personalization
9 Lectures

New price:
Previous price:

Complete SEO course for Beginners: Step-by-Step SEO Mastery
42 Lectures

New price:
Previous price:

Complete SEO for Beginners: Step-by-Step SEO Mastery
42 Lectures

New price:
Previous price:
Expand your career opportunities with our Data Science courses
Commence a successful career in Data Science by learning from industry experts. Learn various approaches online to analyzing large amounts of data to extract crucial insights for business. Learn crucial concepts like Data Structure, Data Mining, Data Analysis, Deep Learning, and more. Become a certified Data Scientist well-versed in tools like SAS, R Programming, Python, etc.
Get Started
Supervised/Unsupervised Machine Learning Projects
14 Lectures

New price:
Previous price:

Artificial Intelligence Masterclass Real-World AI Projects
0 Lectures

New price:
Previous price:

Master AI & Automation: Future-Proof Your Career - A 2023 Guide
100 Lectures

New price:
Previous price:

Mastering Conflict Resolution: Tools, Strategies & Practice
100 Lectures

New price:
Previous price:

Mastering Desk-Bound Wellness: Ergonomics, Nutrition & Movement
100 Lectures

New price:
Previous price:
Expand your Career opportunities with our Web Development courses
Master Web Development by learning how to create and maintain websites like a pro. Learn to develop from a single static page to complex web applications from industry experts online. Become an all-around Web Developer, Front End, Back End, and Full Stack, well-versed in HTML, CSS, React, JavaScript, Bootstrap, Angular JS, Nodejs, and other crucial tools and techniques. Change ‘Students are viewing’ to ‘Students are taking’ or ‘Trending’ or ‘Popular Courses’
Get Started
3 Responsive Web Design Projects Using React and Vite
43 Lectures

New price:
Previous price:

React 19 Mastery: Advanced Patterns, Performance, Routing & more
49 Lectures

New price:
Previous price:

Laravel 12: Online Library Management System (OLMS) From A-Z
100 Lectures

New price:
Previous price:

Front-End Web Development Masterclass: From Beginner to Pro
256 Lectures

New price:
Previous price:
Popular Courses

Stock Market Technical Analysis Course: Beginner to Expert
93 Lectures

New price:
Previous price:

LinkedIn Masterclass: Freelancing & Business Growth
69 Lectures

New price:
Previous price:
Top Categories
Browse our categories to easily navigate through our top courses
Online Certification Programs
Become an expert in top technologies with our extensive online certification programs
Most Popular

Featured

Latest Courses
Stay ahead of the curve with our latest courses
Latest


Supervised/Unsupervised Machine Learning Projects
14 Lectures

New price:
Previous price:

Introduction to Financial Statements
51 Lectures

New price:
Previous price:

Free POSTMAN and SOAP UI Web Services Fundamentals
6 Lectures

Free

Spring Boot Web Applications: The Definitive Guide
90 Lectures

New price:
Previous price:
Featured


Mastering Time Series Analysis and Forecasting with Python
15 Lectures

New price:
Previous price:

Mastering DeepSeekAI: Build from Scratch with Advance Techniques
67 Lectures

New price:
Previous price:

Blockchain Basics and Solidity for Beginners
22 Lectures

New price:
Previous price:

Unlimited AI Content Machine : Build Your Own AI Clone/Twin
9 Lectures

New price:
Previous price:
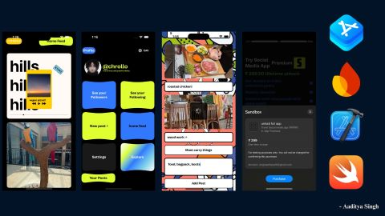
Learn iOS development and build a Social media App: SwiftUI
36 Lectures

New price:
Previous price:
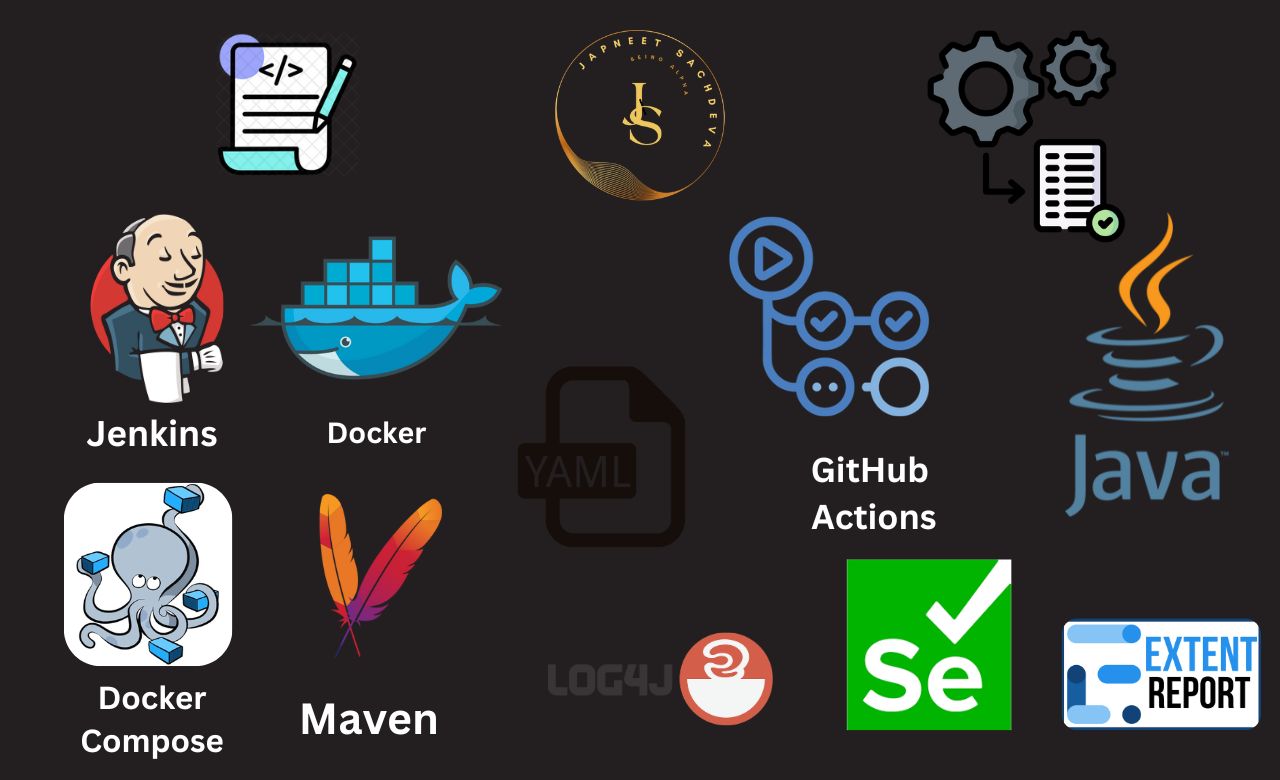
Proficient Automation Tester by Leveraging Docker with CI&CD
34 Lectures

New price:
Previous price:
Applied Time Series Analysis and Forecasting in Python
12 Lectures

New price:
Previous price:
Best Seller


Recon For Bug Bounty, Penetration Testers & Ethical Hackers
97 Lectures

New price:
Previous price:

ChatGPT Masterclass: The Ultimate Beginner's Guide!
40 Lectures

New price:
Previous price:

HTML5 CSS3 and Javascript for Beginners: From Zero to Hero
142 Lectures

New price:
Previous price:

DevOps Interview Questions And Answers: Preparation Guide
70 Lectures

New price:
Previous price:
SQL For Data Science + Data Analytics + Data Visualization
98 Lectures

New price:
Previous price:

Generative AI for Dynamic Java Web Applications with ChatGPT
77 Lectures

New price:
Previous price:

Complete Python Course with 10 Real - World Projects
312 Lectures

New price:
Previous price:

Fundamentals Tools of Probability and Combinatorics
20 Lectures

New price:
Previous price:

SQL for Data Engineers Designing and Building Data Pipelines
32 Lectures

New price:
Previous price:

Supervised/Unsupervised Machine Learning Projects
14 Lectures

New price:
Previous price:

Introduction to Financial Statements
51 Lectures

New price:
Previous price:

Free POSTMAN and SOAP UI Web Services Fundamentals
6 Lectures

Free

Spring Boot Web Applications: The Definitive Guide
90 Lectures

New price:
Previous price:

Mastering Time Series Analysis and Forecasting with Python
15 Lectures

New price:
Previous price:

Mastering DeepSeekAI: Build from Scratch with Advance Techniques
67 Lectures

New price:
Previous price:

Blockchain Basics and Solidity for Beginners
22 Lectures

New price:
Previous price:

Unlimited AI Content Machine : Build Your Own AI Clone/Twin
9 Lectures

New price:
Previous price:

Learn iOS development and build a Social media App: SwiftUI
36 Lectures

New price:
Previous price:

Proficient Automation Tester by Leveraging Docker with CI&CD
34 Lectures

New price:
Previous price:

Applied Time Series Analysis and Forecasting in Python
12 Lectures

New price:
Previous price:

Recon For Bug Bounty, Penetration Testers & Ethical Hackers
97 Lectures

New price:
Previous price:

ChatGPT Masterclass: The Ultimate Beginner's Guide!
40 Lectures

New price:
Previous price:

HTML5 CSS3 and Javascript for Beginners: From Zero to Hero
142 Lectures

New price:
Previous price:

DevOps Interview Questions And Answers: Preparation Guide
70 Lectures

New price:
Previous price:

SQL For Data Science + Data Analytics + Data Visualization
98 Lectures

New price:
Previous price:

Generative AI for Dynamic Java Web Applications with ChatGPT
77 Lectures

New price:
Previous price:

Complete Python Course with 10 Real - World Projects
312 Lectures

New price:
Previous price:

Fundamentals Tools of Probability and Combinatorics
20 Lectures

New price:
Previous price:

SQL for Data Engineers Designing and Building Data Pipelines
32 Lectures

New price:
Previous price:
eBooks
Expand your knowledge with our eBooks
Latest

Featured

Best Seller

Explore Our Top Courses
Delve into our expertly curated top courses to master prominent skills and achieve goals faster
Our students work
with the Best


Feedbacks

Pranav Singh
Java
I recently took the Tutorials Point Java Course and I am so glad I did! The course was incredibly informative and provided me with a comprehensive understanding of the Java language. The instructor was knowledgeable and patient, and the course was easy to follow. I highly recommend this course to anyone looking to learn Java!

Lavanya Trivedi
Python
As a Data Analyst, I needed to enhance my skills to automate tasks and streamline data processing. This Python course provided me with the tools I needed. Learning how to manipulate data, create visualizations, and interact with APIs has transformed the way I work. I now save hours of manual effort by writing Python scripts.

Sukdeep singh
Java
Tutorials Point has provided me with the tools and resources I need to achieve my goals and learn new skills. I have been able to apply what I have learned to my own projects and saw a great improvement in my coding skills. I highly recommend Tutorials Point for anyone looking to learn Java coding.

Supriya Hussian
Python
This course taught me Python, which gave me the knowledge I needed to create and prototype the minimal viable product (MVP) for my startup. I was able to develop a working prototype that won the approval of possible investors thanks to the practical emphasis on creating applications from the start and advice on best practices.

Naveen Boyina
AI&ML
Data analysis to AI conversion needed a thorough understanding of machine learning methods. My expectations were exceeded by this AIML course. The extensive curriculum, combined with real-world assignments and case studies, increased my repertoire of data-driven strategies.
Teach with Us
Become an instructor on our platform to create engaging courses and share your expertise with learners worldwide. Apply to teach with us today and access powerful tools along with other perks.
Apply Now








![Mastering Medical Physics of Diagnostic Radiology [ebook] Mastering Medical Physics of Diagnostic Radiology [ebook]](https://d3mxt5v3yxgcsr.cloudfront.net/courses/21273/course_21273_image.jpg)
![Potgresql PL/PGSQL in-depth [ebook] Potgresql PL/PGSQL in-depth [ebook]](https://d3mxt5v3yxgcsr.cloudfront.net/courses/21244/course_21244_image.png)


![Big Data and Hadoop - 2nd Edition [ebook] Big Data and Hadoop - 2nd Edition [ebook]](https://d3mxt5v3yxgcsr.cloudfront.net/courses/18839/course_18839_image.jpg)
![Practical JavaScript Programming Practices And Projects [eBook] Practical JavaScript Programming Practices And Projects [eBook]](https://d3mxt5v3yxgcsr.cloudfront.net/courses/5451/course_5451_image.jpeg)
![Power BI EBook Step by step for Beginners [ebook] Power BI EBook Step by step for Beginners [ebook]](https://d3mxt5v3yxgcsr.cloudfront.net/courses/18441/course_18441_image.jpg)
![Jira Work Management for Business Teams [ebook] Jira Work Management for Business Teams [ebook]](https://d3mxt5v3yxgcsr.cloudfront.net/courses/13191/course_13191_image.jpg)
![100+ Solutions in Java - 2nd Edition [ebook] 100+ Solutions in Java - 2nd Edition [ebook]](https://d3mxt5v3yxgcsr.cloudfront.net/courses/17590/course_17590_image.jpg)
![Web Development Toolkit for Java Developers [eBook] Web Development Toolkit for Java Developers [eBook]](https://d3mxt5v3yxgcsr.cloudfront.net/courses/17683/course_17683_image.jpg)
![Python Made Easy [ebook] Python Made Easy [ebook]](https://d3mxt5v3yxgcsr.cloudfront.net/courses/18917/course_18917_image.jpg)


